.webp)
If you’ve been in education for long enough to run a school, then you’re probably aware of the children’s TV show Spongebob Squarepants. Spongebob usually has one skill–making Krabby Patties. The rest of the time, his innocence and naivety spur on the plot of the show. However, in one episode, Spongebob has a unique survival skill set derived from his knowledge of the “pioneers.”
Now, get ready for a Spongebob metaphor that you weren’t expecting to have to analyze on an academic level.
In the episode “Pizza Delivery,” Spongebob and Squidward get lost trying to deliver a Krusty Krab pizza. Spongebob keeps trying to use old “pioneer” tricks to navigate back to the customer’s home. At one point, Spongebob puts his ear to the ground in an attempt to locate oncoming traffic. Later, he uses the direction of moss growth to direct their way back to civilization.
At the end of the episode, Spongebob climbs aboard a large rock, claiming it to be an old form of transportation by the pioneers. Much to Squidward’s surprise, Spongebob does, indeed, get the rock to “start,” and they are able to drive it to the customer’s home.
Spongebob doesn’t have a lot to work with in this episode. He’s lost, but he has one goal in mind: find the customer. He’s able to use the guidance of the pioneers to meet his goal and get out of the wilds around Bikini Bottom.
Can you see where we’re going with this?
As principal, you’re sending your teachers and students out into the wilds with data. It’s a confusing place to be when they have nothing to go on! Sure, educators can find trends and outliers with the best of data analysis gurus, but if they don’t know what to do with their analyses, then they’re wanderers–they have nothing to ground them, no compass to guide them.
We took a poll, and out of over 600 responses, 93% of educators in our audience responded that they’re “very confident” in their data analysis skills.
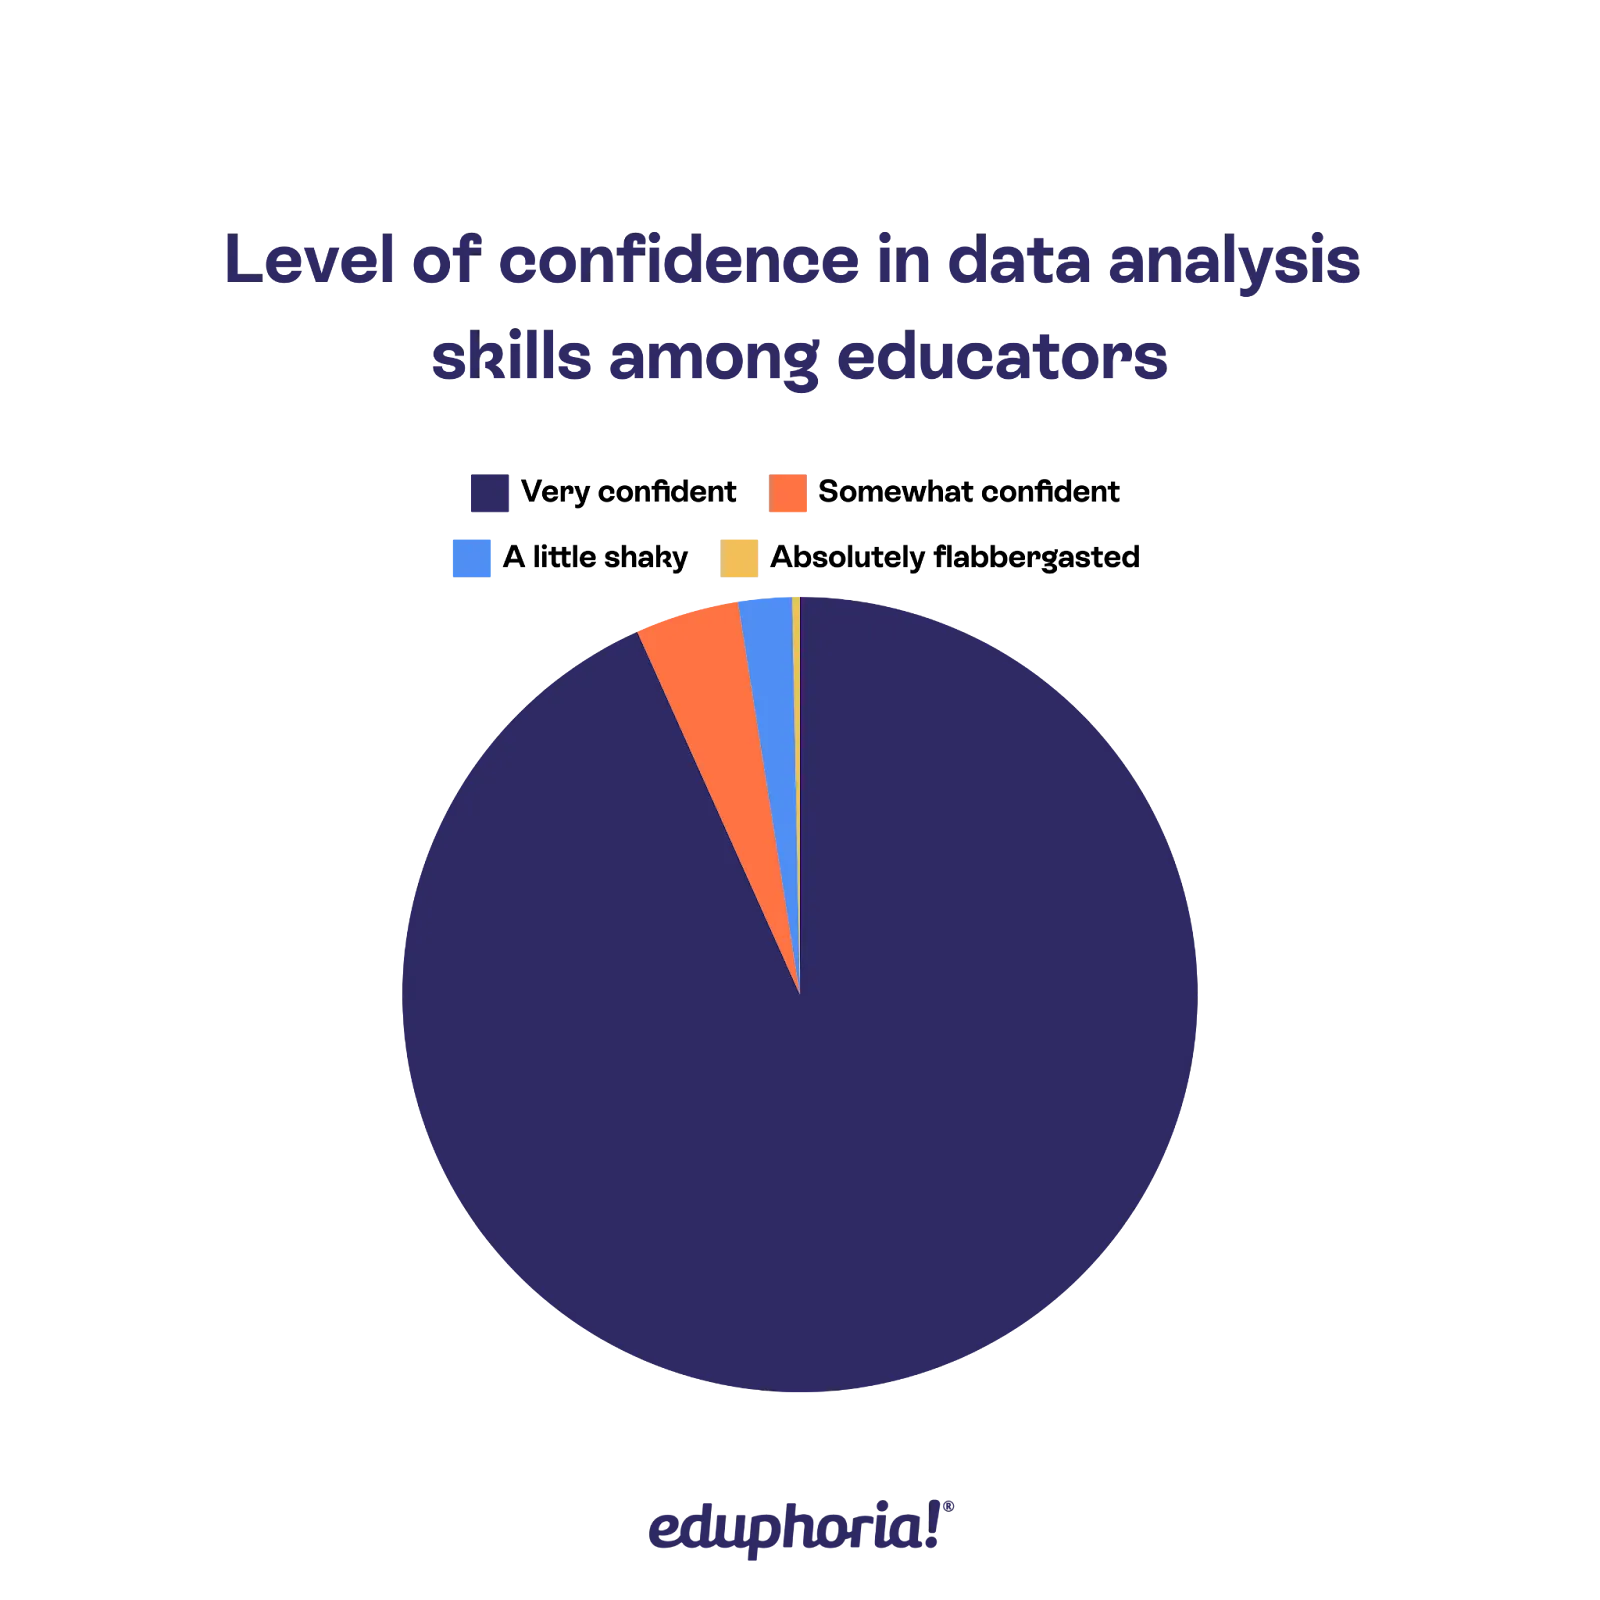
Yet, even the best data wizards at your school need direction. Wendy De La Cruz is an assessment specialist from North East ISD. In response to our poll, she said, “Even though I have a math background, without a clear protocol, even I can get lost in the data.”
Instead of leaving your teachers in the data wilds, you can be the pioneer that helps them find a sense of direction and meet their goals.
So, how can principals become data pioneers? In this article, we’ll use research and the expertise of our Eduphoria team to get into the details.
Jump ahead
Step two: Make your ideologies into a culture
Develop your data doctrine with Aware and Strive
Implement and manage culture changes with Strive
Model your culture with continual support from Eduphoria
Enjoy a detailed walkthrough of our software solutions

Just as the pioneers of Bikini Bottom created and spread their ideology to guide the generations that followed, so must you, dear reader, create your ideology, starting with foundational culture changes that will allow your data philosophy to prosper.
Schools with a positive growth culture are collaborative, open, and supportive. While these attitudes already exist in your school, they need leadership to manifest in a useful way. In his article, “The Role of Leaders in Developing a Positive Culture,” Robert Dinsdale talks about how school leaders shape their school’s culture to be collaborative, open, and supportive in a way that encourages growth.
Here are three key points:
- Both student learning and the success of school staff can be helped or hindered by school leaders
- The tone that a leader creates can determine whether a school is focused on growth
- The success of innovation and initiatives within a school can be dependent on the culture a leader creates
In other words, to make secure, long-lasting changes to a school (including student growth), leaders must create a foundational culture that lends itself to the use of data.
School leaders set their community’s growth culture into place by developing and spreading their data ideology. This will form the foundation upon which the rest of your culture will be built.
Leaders in the right places
Creating and molding the culture of your school can feel intimidating. You may even feel that you have no business leaving such a prominent mark.
While your data ideology will be founded on your beliefs, it will be supported by data and fueled by the needs of your students and staff. A strong data ideology considers the needs of the school as its guiding compass. We’ll explore how you can use data to form worthwhile goals and markers of success later in the article. For now, let’s stick to a high-level view.
While every member of your community will contribute to the culture of your school, the principal should be the author, publisher, and distributor of its core tenets–its ideology. Administrators such as vice principals and grade-level admin are, then, the representatives of a principal’s cultural movement. They will keep your data ideology alive by enacting the tenets and steps you describe.
Therefore, it is essential to make sure you have leaders with the relevant passions and skill sets in the right positions, or you guide current leaders into understanding and implementing your tenants through professional learning.
Questions to ask that will help you form your data ideology
Harvard Graduate School of Education published a resource about how school leaders shape their school’s cultures. They included questions for principals to consider when deciding the tone they want to establish. We’ve condensed, added to, and modified these to guide your thought process. Here is our revised list of questions:
- What are your goals for the community? Think about how you’d like your students to grow, where they struggle most, and where they excel.
- Where would you like to see more collaboration? Do you want grade levels of all subjects to cross-collaborate? Do you want admin and PLCs to spend more time discussing student needs?
- What are your objectives? Write a list of things you’d like to accomplish, thinking about the highest areas of need. Can you think of specific steps or prerequisites that need to occur before you can meet these objectives?
- Which objectives are most foundational? Consider which objectives have the potential to inspire other culture changes, and prioritize them. You don’t want your initiative to collapse under the weight of too many lofty goals.
- What would growth look like if you were to accomplish your goals? Would there be a larger percentage of students who achieve mastery? Would there be an increased number of students attending their regularly scheduled classes?
After you’ve answered these questions, you can begin to formulate your data doctrine. Turn your thoughts here into “I believe” statements.
Writing out your data doctrine
The things you observe and believe to be true about your school will form the basis of your doctrine.
Here are some examples of “I believe” statements:
“I believe that students should know of every opportunity available to them, whether through tutoring, advanced placement, or extracurricular activities.”
“I believe teachers should be the ones making curriculum decisions.”
“I believe the administration should provide, analyze, and explain data trends to teachers so they can make curriculum decisions.”
“I believe student growth can manifest in ways that may not be measurable by test scores.”
When you’ve written your statements, you can begin your marketing campaign. Just as the pioneers in Bikini Bottom spread their ideology far and wide so critters like Spongebob could make use of its directives, you must use your campaign to spread the word about what’s important and how your school staff can reach the goals they all believe to be important.
It can be time-consuming to create a messaging campaign when you’re dealing with day-to-day obligations of a principal. Just remember that you’re not alone. You have a building of experts invested in your students’ growth just as much as you are. It’s time to bring department heads together, invite your administrators, and talk to tutors and district leaders. Chances are, many of them have the same passions and ideas as you do and have thoughts about how to help.

Step two is when you determine what kinds of professional development and documentation you will need. How will you create this data culture at each level of your school?
While the pioneers of Bikini Bottom likely used oral tradition to pass down their recommendations, you must clearly communicate your beliefs and data survival skills in writing.
Signage helps to spread the word
You can create signage encouraging students and teachers to participate in the areas you believe to be most essential to student growth.
For example, let's say you have a belief statement like this: “I believe students are missing out on personal and academic growth opportunities due to low participation in extracurriculars.”
To remedy this, your team can create, print, and post signage that advertises your extracurricular programs, their benefits, and the rewards a student might experience when they join.
How can students take advantage of opportunities that they don’t know exist?
Procedures clear up misconceptions and uncertainty
When done correctly, written procedures offer your teachers and administrators more freedom, not less.
In his article on Medium, Dr. Sean McClure describes the difference between “good constraints” and “bad constraints” when it comes to creative freedom.
Good constraints:
- Clarify uncertainties and guarantee a result
- Lead to genuine freedom because of guaranteed results
- Create and reinforce structure
- Arrange relationships between parts of a project
- Guide and compel creativity
As principal, it’s your responsibility to create good constraints that compel creativity, freedom, and results. Written procedures allow for that kind of freedom.
Here is an example of a procedure that compels creativity:
The need: Students need intervention and retests
The goal: Provide teachers with expectations on the use of assessment data to meet the identified need
The procedure:
- “Within one week of a benchmark assessment, administrators should aggregate data and determine which students need additional instruction in the tested learning domains.”
- “Within two to four weeks, teachers should plan and implement reteaching initiatives that target the individual learning needs of their students.”
- “During that period, PLC leaders should meet with their departments to troubleshoot problems and encourage resource sharing and idea generation.”
- “Within two months of the assessment, teachers should issue a retest to measure and report that student’s growth.”
- “Once that data is collected, teachers or team leaders should send it to the grade level admin for aggregation.”
- “Grade level admin should report retest scores and growth data to the principal within two weeks of receiving retest data.”
This procedure doesn’t determine how teachers should reteach, nor does it tell them what to do to reach those students. Teachers are experts in these areas already. By providing them with good constraints, they don’t have to worry about the details like “when is the best time to issue a retest?” You already built the answer into the procedure.
They can focus on what they do best–teaching, guiding, and improving student growth.
By including specific roles and time frames, every person knows what is expected of them and what they need to do to meet those expectations. There’s no “anxious guessing,” nor does anyone feel lost about the next steps. Predictability is one of those good constraints that frees up your staff to make plans and be creative.
Bonus points if you have “due dates” on the same day every month or at other predictable periods. If you have a data management system that allows students, teachers, and admin to access the same data without a cumbersome communications process–that’s an even bigger bonus.
We should also add that procedures shouldn’t be punishing–only helpful. If teachers are struggling with implementation, then school leaders need to assess what kinds of support teachers need and how some of the work can be offloaded and shared with adapted procedures.
Professional development ingrains your culture and ideology
You’ve developed a list of objectives and needs, you’ve written your belief statements, and now you’re creating an action plan to realize those objectives. Professional development will be an important tool in training your staff to solve the problems you’ve identified.
What are some of the most pressing issues your school faces regarding student growth?
Use your concerns to create and share relevant professional learning for your staff.
Are your students struggling to overcome motivation hurdles due to low self-confidence?
Host a conference on creating expectancy and increasing the perceived value of learning.
You may also need to create and share professional learning on the procedures you’re adopting (such as the multi-step procedure outlined in the previous section). Teachers and administrators should feel fully prepared, informed, and supported so they can make your vision a reality. Training will create a stable foundation for your skilled and creative staff to build upon.
If you’re using software to support your initiatives, your staff will certainly need training on its use and implementation.

The pioneers of Bikini Bottom spread the word regarding the respect and navigation of the wilds by living the lifestyle. They practiced what they preached.
Now’s the time to be a true pioneer and do what you are asking your staff to do. When others can see that skill in action, it’s easier to emulate. This is why modeling is a crucial aspect of instruction.
Now’s the time to lead by example. It’s time to model your data ideology. Start by building your own procedures that will help you to plan time for and honor your data practices.
Next, model your student growth-centered culture and demonstrate the value of your ideologies.
Establish a data management system and use it
The Department of Education published an in-depth resource on instructional decision-making. We recommend you save it for long-term study, as it’s a heavy-duty resource on the ins and outs of developing a data-centric school culture. However, one of the most important steps they mention is one we wholeheartedly support as an education software company.
This step? Buy and use a data warehouse, a “computer system that stores educational information from several sources and integrates it into a single electronic source. Data warehouses are designed to allow the manipulation, updating, and control of multiple databases that are connected to one another via individual student identification numbers” (47).
As an education tech company that sells a robust data warehouse subscription, you can see why we’d be huge proponents of a research-backed reason to purchase data management software!
All kidding aside, having a data management system is essential to fostering a student growth culture. Without data and without a means of collecting, organizing, and analyzing that data, how can one determine goals, action steps, and markers of success?
If possible at all, it would be very difficult and time-consuming without a data management system.
The data system that you decide to use needs to hit several markers according to the definition provided by the Department of Education:
- It should be searchable and organized by student ID
- It should aggregate and store data from several sources
- It should allow the manipulation and control of data
- It should integrate several different kinds of data for a holistic view
- Data should be exportable, shareable, and secure
It just so happens that Strive and Aware work together to meet all of these requirements and offer these additional perks:
- Create instant, easy-to-interpret data visualizations for teachers, admin, principals, and district leaders
- Compile and export spreadsheets for student monitoring initiatives
- Track the success of professional learning initiatives
- Create and share professional learning opportunities
- Use data to show the relationship between teacher and student growth in your school
- Allow students to access assessment data and reflect on their learning
- Analyze a single test to determine which students need additional support in a specific learning domain
- Analyze multiple tests to see whether local assessments predict success on standardized tests
- See grade-level, year-to-year growth on major exams
- Track the success of reteaching initiatives through teacher evaluations and student growth portfolios
Now, you may not be ready to purchase a data system, so let’s get into how you can model a student growth culture without our products. Then, we’ll show you how easy it can be with Eduphoria.
You will model the student growth culture you want to implement by collecting and analyzing data. Data will inform your objectives and help you to create a plan that will change the culture of your school.
Start by collecting your own data:
- Look for assessment trends
- Take surveys of consistent behavioral issues
- Check attendance records
- Analyze graduation rates, college acceptance, scholarship awards
- Meet with teachers to learn about unmet needs
All of this is data collection! If you don’t have a data management system, many free options are available to help you organize your data. Here’s a resource from Google on creating a spreadsheet and importing data.
When you have an idea of your greatest needs, you can analyze that data and make decisions.
Here are some questions to ask when analyzing the data you gather:
- What stands out? What are the highs and lows? It may help to develop a hypothesis about why these highs and lows exist, especially if you can cross-reference these trends with corresponding data sets.
- What is matching up to your observations? Does your data support your belief statements, or does it turn them on their heads? Does any of the data you gather support the hypotheses you’ve already made?
- What pieces of data are the most representative of the larger whole? Decisions you make based on this information will have the largest area of effect.
- What is surprising to you? Is there anything you didn’t know about that makes you think you need more information?
- Where does the data contradict? For example, do two related pieces of data trend in opposite directions?
Keep in mind that some people in your staff may be better equipped to help you find and assess data conclusions. Your attendance clerks, testing administrators, and college readiness advisors would be excellent resources.
When you start making decisions based on this data, you’re creating procedures. You’re modeling your culture. Communicating your findings and justifying your choices is an excellent way to model data-backed decision-making.
For example, say the data shows that the majority of English Language Learners at your school have excellent attendance and graduation rates but aren’t receiving scholarships in proportion to their peers.
You can use this data to develop procedures and design professional learning for ELL teachers, college readiness advisors, and scholarship committees. You may even create signage specifically for ELL classrooms advertising annual scholarships. As a procedure, you designate a senior administrator to speak regularly throughout the year, helping students to find, apply for, and secure college scholarships.
In this scenario, you’ve not only modeled how to use data to make culture changes, you’ve also changed the system on a foundational level, so students can be identified and uplifted based on their unique needs.
How can software help you create a student growth culture?

We hope that after reading this article, it seems not only possible but plausible that you can create a student growth culture at your school. However, if it feels like there are a lot of moving parts to manage, then we have a solution you may be interested in. Let’s revisit all of the steps and talk about how Eduphoria can simplify the process:
You may have some things that you know to be true about your school. It’s okay to write these things down and gather information to confirm that these problems exist outside of your perception. However, when you have a data management system in place, it’s a lot easier to come up with beliefs, theories, and statements that are objectively true of the state of your school.
With Aware, district leaders and administrators can use long-term assessment trends to identify strengths and weaknesses in their student body and in their curriculum.
Use Multi-Test Analysis to form data-based theories about student growth trends
Take a look at Multi-Test Analysis (MTA). MTA is a tool within Aware Premium that allows those with the ability to create a progress profile to convert and compare multiple assessments.
If you’re not much of a math person, you may not realize how significant it is to be able to compare assessments that were built with different metrics. Think about this: If you want to learn how hot it is in London compared to Texas, you won’t have immediately usable data (unless you’re a Celcius guru).
First, you’ll have to convert the temperature in London to Fahrenheit to have a usable metric to compare with Texas.
It’s very similar with the assessments we write, implement, and measure. Not every test is built and measured with the same metrics. For example, how do you easily compare the scores of a local test to an NWEA MAP assessment? Like converting Celcius to Fahrenheit, you need to convert RIT scores to raw scores.
Multi-Test Analysis allows you to group up to 20 assessments to analyze long-term needs and trends within the student body. When you create a progress profile, you define the achievement levels by which all of these assessments will be compared.
Once the progress profile is complete, you can see how students are distributed along each achievement level you define.

With such a clear visual representation, you can more easily create theories about the strengths and weaknesses of your tests, your students, and your curriculum.
In the above graphic, notice how overall achievement has decreased from 2021 to 2024. With this information, you could start to ask questions. What has changed since 2021? Perhaps your school, like most of our schools, was hit particularly hard by COVID-19. However, if this is your conclusion, there are ways to refine that analysis and hit on some weaknesses that can be targeted with new incentives.
For example, you can refine the data you see to identify trends per district, school, teacher, student, and demographic. If you’d like to see how your SPED students are affected by the pandemic-related changes you observed, you can filter the results to that level of specificity.
You can also see how well each of the tests in your progress profile predicts scores on the other tests.

Note that a score of 1 would mean a perfect correlation. In the above example, the Math G3 District Checkpoint strongly correlates with the Spring 2022-2023 NWEA assessment. We can assume, based on this data, that the checkpoint strongly predicts the scores of the chosen summative assessment. Thus, it is a valid and reliable assessment.
Using this table, you can also develop some theories about your other assessments. Which assessments show the lowest correlations? Are there steps we need to take to better align our assessments either in content, rigor, or something else?
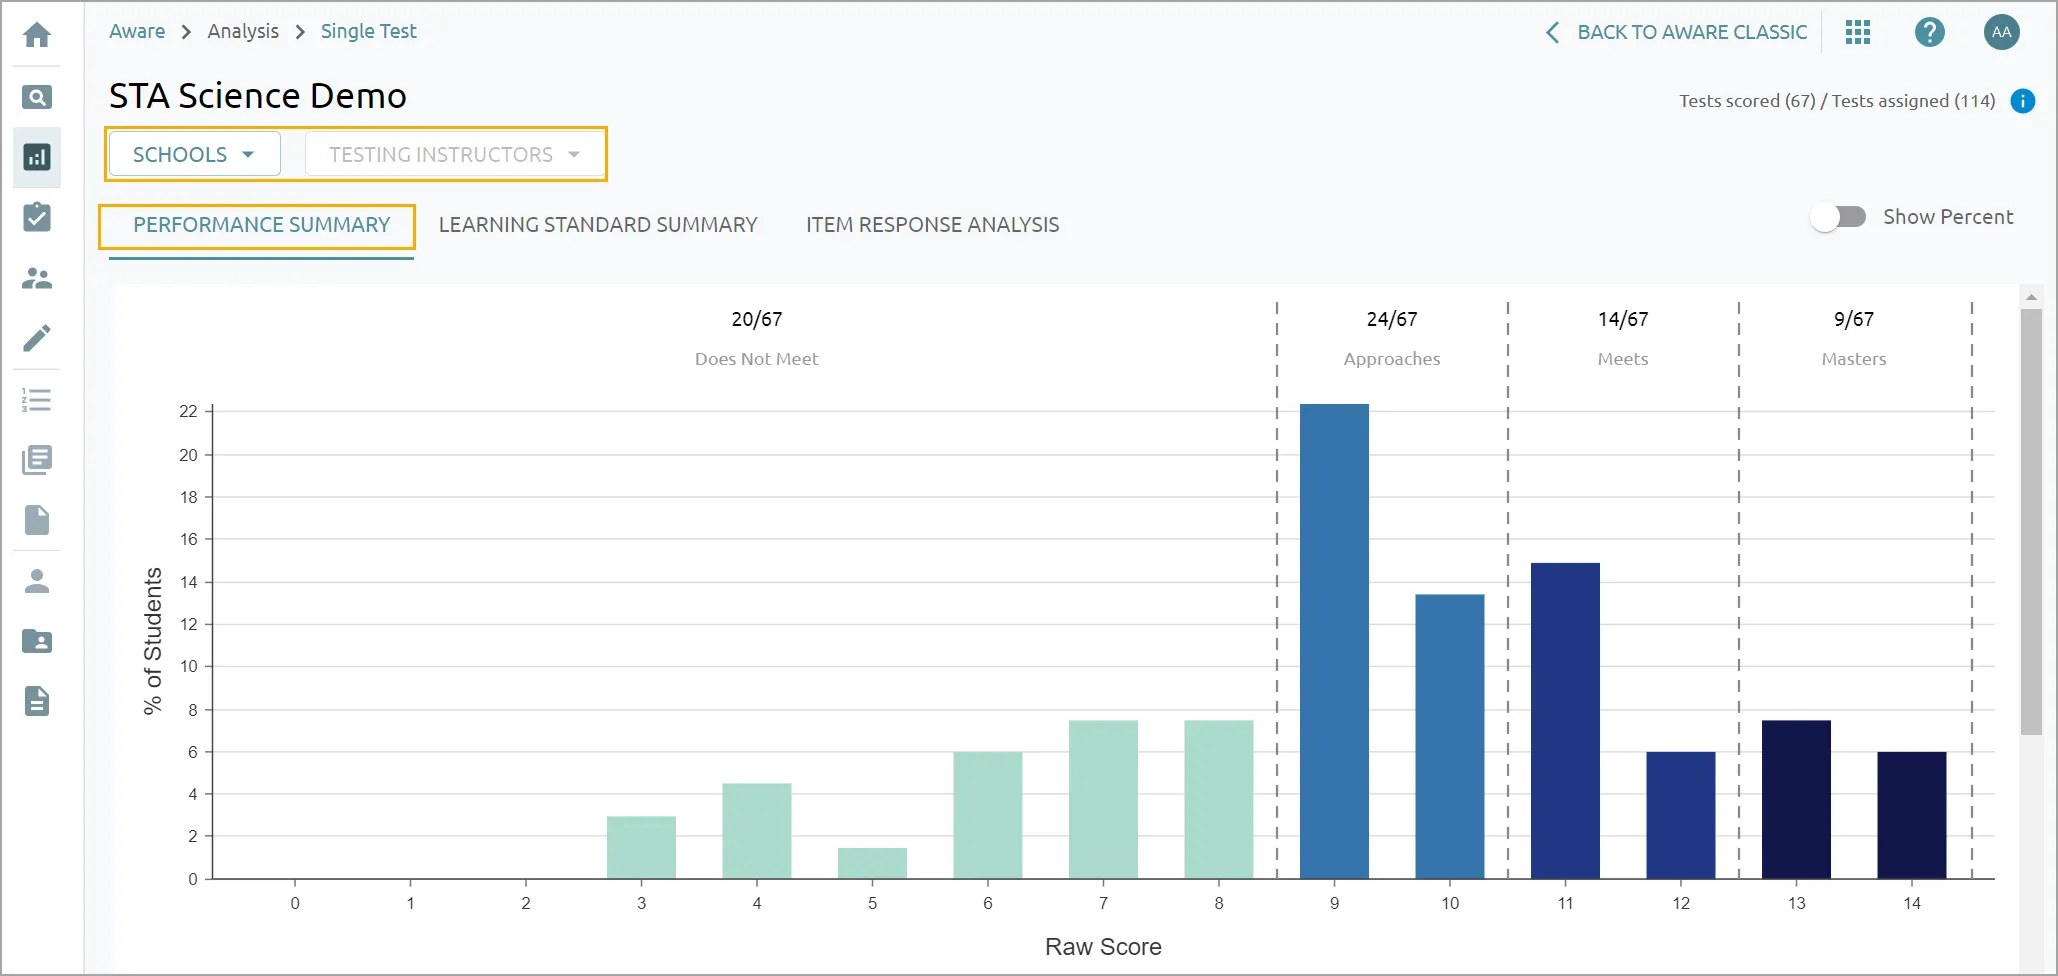
Now, it’s time to bring out our other powerhouse data visualization tool: Single Test Analysis (STA).
Use Single-Test Analysis to identify test-specific and student-body learning gaps
Both teachers and administrators can analyze assessments with STA. With Single-Test Analysis, teachers can dive deeper into specific assessments to see how well students perform per learning domain. What is the percentage of mastery in these domains? Are students reaching greater depths of knowledge, or are they missing key building blocks?

Principals can also see this information, but you will be able to see assessments school-wide. If you are suspicious about a specific test that didn’t have a high correlation in the MTA correlation view, you can find and analyze that assessment with STA.
Along with this high-level view, you can dig deeper into this information by viewing specific questions, student responses, and demographic distributions. The raw score bar chart that displays in the performance summary will change with each new filter you apply.
This is when you can start applying the data filtering questions we mentioned in the process example.
Use Strive to determine professional learning needs
Finally, Strive is our professional growth software. Strive integrates beautifully with Aware in several ways, but one key feature is our scatterplot graph, another data visualization tool that makes it easy to come to data-backed conclusions.
Using this correlation view, district leaders and administrators can see data contradictions and trends that may be worth investigating. For example, look at the scatterplot below.
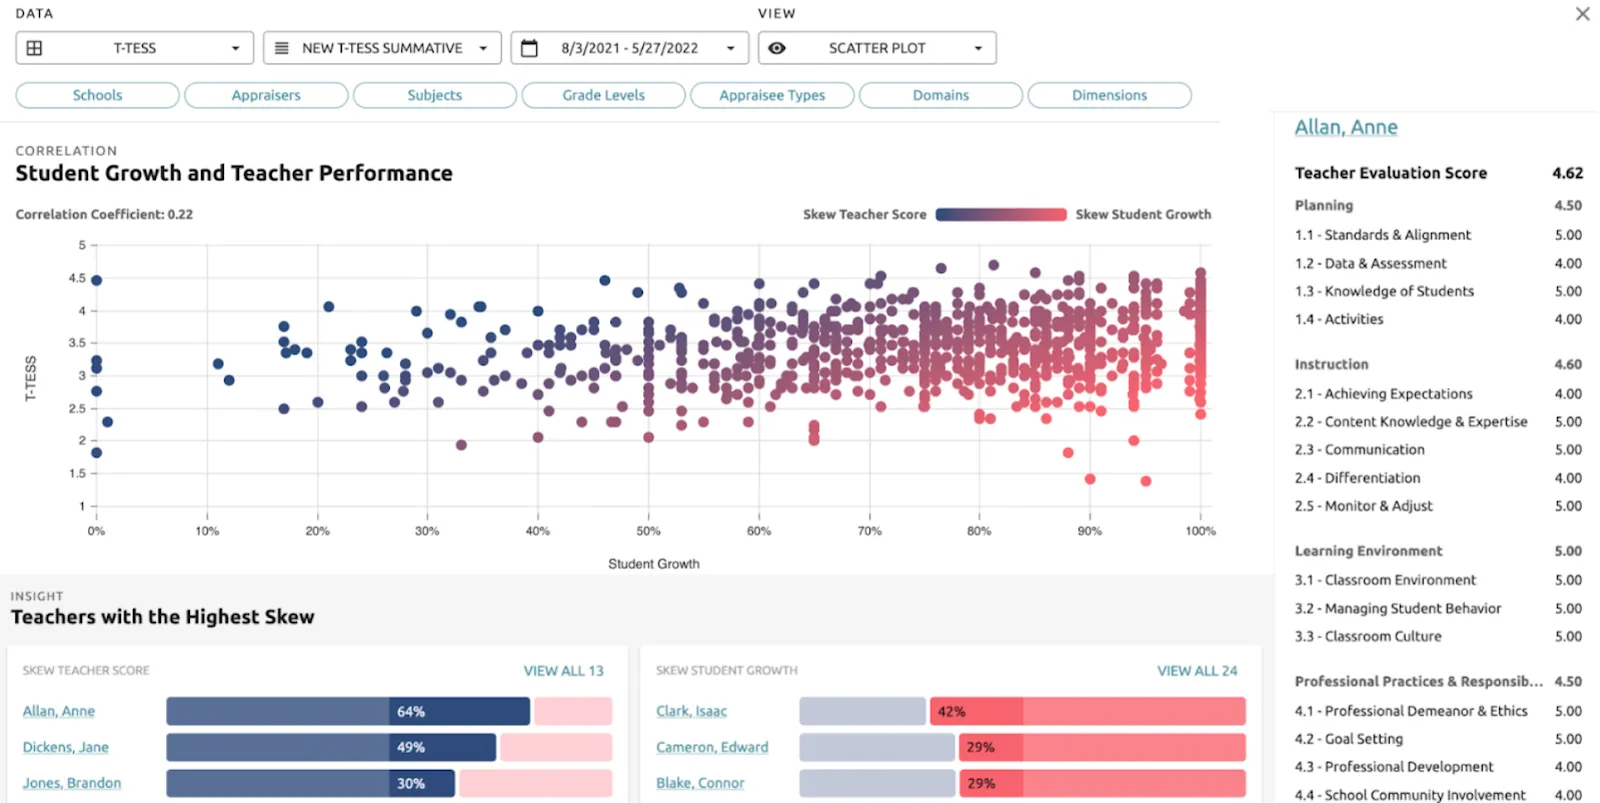
The graph shows how teacher evaluation ratings and student growth scores compare. Teachers with high levels of skew will be identified at the bottom of the graph. Administrators can then investigate further by clicking on each teacher’s name.
Skew can happen because of many different reasons. However, it may reflect one of two relevant scenarios. If a teacher received a very high evaluation rating, but their student’s growth scores are low, they would appear as a dark blue dot on the far left side, upper quadrant of this graph. Perhaps a teacher’s students are excelling, but their evaluation ratings don’t reflect their proficiency as a teacher (they would be a bright pink dot on the far right side, lower quadrant). With this view, administrators can not only identify which teachers are already embodying a student growth culture, but they can also identify areas where teachers need more support to grow their skills. They may even identify which administrators need help identifying those skills in your teachers.
With this information, you can begin to plan your professional development and procedural changes. Here are some areas you may want to consider when brainstorming professional learning sessions for your school based on the scatterplot graph:
- Bias among administrators that results in inaccurate teacher evaluation ratings
- Low student growth scores among tenured and high-performing teachers
- No student growth or negative trends in student growth per teacher
Strive is a multi-use tool that can help schools establish and maintain a data-driven culture. We already wrote a comprehensive resource on how district leaders and administrators can use Strive to eliminate bias in their evaluation process. In this article, we went into detail about how a data-backed evaluation system can improve student growth.
So, rather than rehashing what we’ve already mentioned, we’re excited to talk about what makes Strive such a game-changer for school leaders aiming to unify a school’s vision.
Now that you have an idea of what you’d like to target in your student growth cultural campaign, it’s time to establish procedures.
Let’s say you’d like your teachers to start using culturally inclusive language in their lessons. This is so important to you that you’ve added it as a criterion on your teacher evaluation forms. Now, it’s established that you’re expecting changes in the curriculum (through training and development), you have a way to measure it (via teacher evaluation forms), and you can track the success of your initiatives (through data visualization).
So, the best place to start is by providing the proper training, so teachers have the skills and knowledge to implement the changes you need.
With Strive, you can create asynchronous learning opportunities, host conferences, invite guest lecturers for digital conferences, and link every learning opportunity you create to a specific professional development growth goal (that way, teachers with goals pertaining to that need can easily search for and enroll in that professional learning).
You can also link the learning opportunities you provide to the domains and criteria on their teacher evaluations. Teachers can even request professional learning opportunities based on their professional growth goals! Providing relevant learning opportunities in this way will unify your goal and vision; it will be a means of systemic change.
You can begin to see how it might be helpful to craft your professional learning culture and professional development opportunities based on the trends you’ve identified in your data analysis.
Not only will the opportunities you create be relevant, but they’ll be incredibly specific to your school’s needs.
When your teachers have learned what they need to know, and you’re evaluating their progress, you can even see their students’ growth within Strive using the student portfolio. All of these means of cross-referencing the success of your cultural initiative can help you to track your progress, make iterative changes as needed, and maintain positive results.
Dr. Jeremy Wagner is a Product Manager at Eduphoria. Previously, he served as the Director of STEM and Advanced Academics at Lubbock-Cooper ISD, where he helped his district to evaluate and establish strong data-centric culture changes.
In reference to creating a positive growth culture, he had this to say:
“A positive data culture can be riddled with misinformation or a lack of understanding of the goals of a true data-rich process. It’s not enough to simply ‘look at the data.’ You have to investigate and then respond. Positive data culture allows for time to remediate, forgives mistakes in the presence of response, sets goals, honors goal attainment, and always highlights the positive. Identify your weaknesses, but honor your strengths. [It] has to be founded in a solid process with appropriate follow-through. Any process has to start with data literacy. What is the data telling you and how do you know? What do you look for? Once you’ve found it, what are you going to do about it, and how are you going to monitor it? Without answers to these questions, you only have a data-rich environment with no actionable plans.”
We’ve talked about how to:
- Investigate
- See what the data is telling you
- Respond
- Set goals
- Honor goal attainment
- Create actionable plans
Now, let’s talk about follow-through.
You can and should continue to model your new culture by using data to measure the success of your system and develop new growth-minded initiatives. Keep checking in. Make necessary changes. And help your staff make the most of the tools they have so they can develop their own student growth cultures in their classrooms.
At Eduphoria, we want to support you. We want to help you make targeted changes that will benefit students and educators alike. When you purchase Eduphoria products, we don’t leave you to become an expert on the ins and outs of the software overnight. We are with you for the long run. We hope you’ll allow us to support you through purchasing, integration, and any hiccups you may experience while using our software.
If you’d like to see more of what our software can do, reach out to our team at sales@eduphoria.com. Also, make sure to use our walkthroughs to see what our software looks like in action.
Experience Single-Test Analysis
See a Multi-Test Analysis Demo
Take a look at the Detailed Analysis View in Strive


.png)
.png)